Advancing the Frontiers of Neurodegenerative Disease Research
| Product Name | Amyloid Beta 1-42 Pre-formed Fibrils | |||||||||||||||||||||||||||||||||||||||||||||||||||||||||||||||||||||||||||||||||
| Description |
Human Synthetic Amyloid Beta 1-42 PFFs |
|||||||||||||||||||||||||||||||||||||||||||||||||||||||||||||||||||||||||||||||||
| Applications | WB, In vivo Assay, In vitro Assay | |||||||||||||||||||||||||||||||||||||||||||||||||||||||||||||||||||||||||||||||||
| Concentration | 1 mg/ml | |||||||||||||||||||||||||||||||||||||||||||||||||||||||||||||||||||||||||||||||||
| Conjugates |
No tag
StreptavidinProperties:
Biotin
|
|||||||||||||||||||||||||||||||||||||||||||||||||||||||||||||||||||||||||||||||||
| Nature | Synthetic (TFA preparation) | |||||||||||||||||||||||||||||||||||||||||||||||||||||||||||||||||||||||||||||||||
| Species | Human | |||||||||||||||||||||||||||||||||||||||||||||||||||||||||||||||||||||||||||||||||
| Expression System | Synthetic | |||||||||||||||||||||||||||||||||||||||||||||||||||||||||||||||||||||||||||||||||
| Amino Acid Sequence | DAEFRHDSGYEVHHQKLVFFAEDVGSNKGAIIGLMVGGVVIA | |||||||||||||||||||||||||||||||||||||||||||||||||||||||||||||||||||||||||||||||||
| Purity | >95% | |||||||||||||||||||||||||||||||||||||||||||||||||||||||||||||||||||||||||||||||||
| Other Resources | Sonication Protocol | |||||||||||||||||||||||||||||||||||||||||||||||||||||||||||||||||||||||||||||||||
| Protein Length | 42 amino acids | |||||||||||||||||||||||||||||||||||||||||||||||||||||||||||||||||||||||||||||||||
| Protein Size | 4.5 kDa | |||||||||||||||||||||||||||||||||||||||||||||||||||||||||||||||||||||||||||||||||
| Field of Use | Not for use in humans. Not for use in diagnostics or therapeutics. For in vitro research use only. | |||||||||||||||||||||||||||||||||||||||||||||||||||||||||||||||||||||||||||||||||
Properties
| Storage Buffer | 10 mM HCl + 2% DMSO |
| Storage Temperature | -80ºC |
| Shipping Temperature | Dry Ice. Shipping note: Product will be shipped separately from other products purchased in the same order. |
| Purification | N/A |
| Cite This Product | Human Synthetic (TFA preparation) Amyloid Beta 1-42 Pre-formed Fibrils (StressMarq Biosciences | Victoria, BC CANADA | Catalog# SPR-487) |
| Certificate of Analysis | Certified >95% pure using mass spec and HPLC. Low endotoxin <2.5 EU/mL @ 1mg/mL. |
| Other Relevant Information | For best results, sonicate immediately prior to use. Refer to the Neurodegenerative Protein Handling Instructions on our website, or the product datasheet for further information. Monomer source is catalog# SPR-485. |
Biological Description
| Alternative Names | Aβ 1-42, Amyloid beta, Beta amyloid peptide, Abeta, Abeta peptide, Amyloid beta precursor peptide, APP, Beta-APP42, Abeta42, A4, ABPP, APPI, Alzheimer disease amyloid A4, Alzheimer disease amyloid, Cerebral vascular amyloid peptide, PreA4, Protease nexin-II, PN-II, Amyloid Beta PFFs |
| Research Areas | Alzheimer's Disease, Amyloid, Neurodegeneration, Neuroscience |
| Cellular Localization | Cell membrane, Intracellular Vesicles |
| Gene ID | 351 |
| Swiss Prot | P05067 |
| Scientific Background |
Amyloid beta (Aβ) peptides, particularly the 42-residue variant Aβ 1-42, are central to the pathology of Alzheimer’s disease. Derived from the cleavage of amyloid precursor protein (APP), Aβ 1-42 is highly prone to misfolding and aggregation. Among its aggregated forms, pre-formed fibrils (PFFs) replicate the β-sheet-rich structures found in amyloid plaques and cerebrovascular deposits in affected brains. [www.uniprot.org] Aβ 1-42 PFFs are widely used in neurodegenerative disease research to model the progression of amyloid pathology. These fibrils exhibit high structural stability and neurotoxicity, making them ideal for studying mechanisms of synaptic dysfunction, oxidative stress, and neuroinflammation. Their ability to seed endogenous Aβ aggregation and propagate pathology across brain regions mirrors the prion-like behavior observed in Alzheimer’s disease. In experimental systems, Aβ 1-42 PFFs enable high-resolution analysis of aggregation kinetics, cellular uptake, and downstream signaling disruptions. They are also instrumental in evaluating therapeutic strategies aimed at inhibiting fibril formation, enhancing clearance, and blocking intercellular transmission. By providing a reproducible and disease-relevant platform, Aβ 1-42 pre-formed fibrils accelerate biomarker discovery and the development of targeted interventions, positioning them as a cornerstone in translational Alzheimer’s research. StressMarq's Amyloid Beta 1-42 (Aβ42) Pre-formed Fibrils are generated from Amyloid Beta Peptide 1-42 pre-treated with 1,1,1,3,3,3-Hexafluoro-2-propanol (HFIP) using a previously published method (1,2). StressMarq's Aβ42 fibrils present as long strands when observed under TEM and AFM, and have a unique high molecular weight signal on a Western Blot with an anti-amyloid beta antibody. Sonicated Aβ42 fibrils showed dose‑dependently toxic to primary rat cortical neurons. |
| References |
1. Stine et al. 2003. JBC. 278(13):11612-22. doi: 10.1074/jbc.M210207200 2. Chromy et al. 2003. Biochemistry. 42:12749-12760. doi: 10.1021/bi030029q 3. Panza et al. 2019. Nat Rev Neurol. 15:73-88 https://doi.org/10.1038/s41582-018-0116-6 4. Shankar et al. 2008. Nat Med. 14(8):837-842. doi: 10.1038/nm1782 5. Kayed et al. 2003. Science. 300(5618): 486-489. doi: 10.1126/science.1079469 6. Want et al. 2016. JAMA Neurol. 73(9):1070-7. doi: 10.1001/jamaneurol.2016.2078 7. Kotzbauer et al. 2012. Arch Neurol. 69(10): 1326-1331. doi: 10.1001/archneurol.2012.1608 |
Product Images
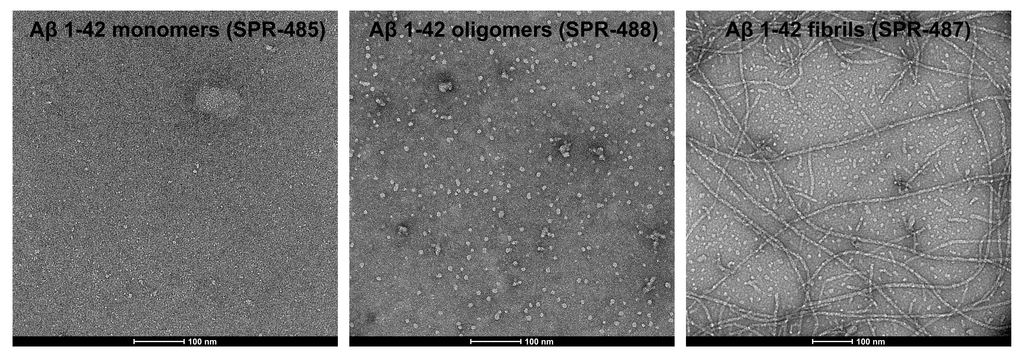
TEM of amyloid beta 1-42 monomers (SPR-485, left), oligomers (SPR-488, middle) and fibrils (SPR-487, right). Negative stain transmission electron microscopy images acquired at 80 Kv on carbon coated 400 mesh copper grids using phosphotungstic acid and uranyl acetate stain. Scale bar = 100 nm.
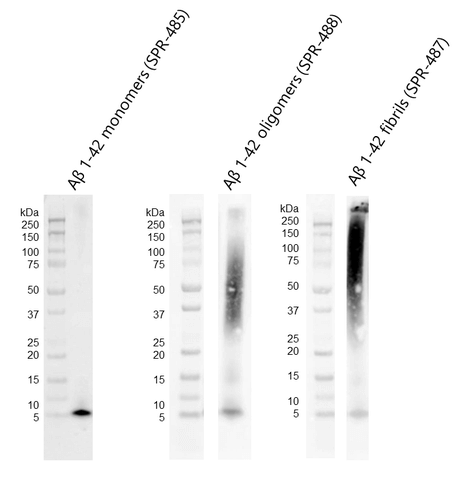
Western blot of amyloid beta 1-42 monomers (SPR-485, left), oligomers (SPR-488, middle) and fibrils (SPR-487, right) using anti-amyloid beta 6E10 antibody. Amyloid beta constructs at 160 pmol were run on 4-12% Bis-Tris SDS-PAGE, transferred to nitrocellulose in the presence of 0.02% v/v Tween-20, and blotted with 1:1000 mouse 6E10 primary antibody (Biolegend). Oligomers observed under TEM/AFM appear as distinct dimer/trimer bands at ~37-75 kDa on Western Blot with 6E10 antibody (middle). Fibrils observed under TEM/AFM appear as a distinct signal at greater than 100 kDa in the stacking gel (right).
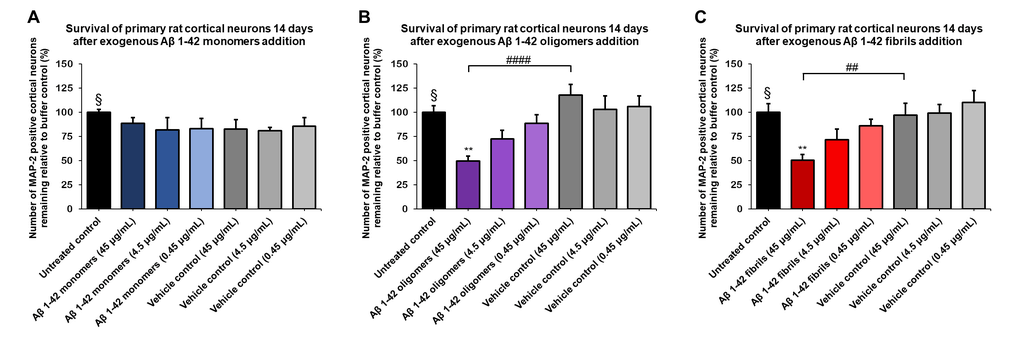
Amyloid beta 1-42 oligomers (SPR-488) and fibrils (SPR-487) show a dose-dependent toxicity to primary rat cortical neurons, but not monomers (SPR-485). Survival of rat primary cortical neurons 14 days after treatment with different concentrations of (A) monomers, (B) oligomers or (C) fibrils quantified by MAP2 positive neurons and expressed as a percentage of control. Fibrils and respective vehicle controls were initially sonicated in a Bioruptor. Test conditions were run in the same plate as untreated control and vehicle controls, which consisted of buffer without amyloid beta 1-42 protein. Data expressed as mean +/- s.e.m. (n=6). A global analysis of the data was performed using a one-way ANOVA followed by Dunnett’s test; ** p<0.01 stats vs control; ## p<0.01, #### p<0.0001 stats vs vehicle control. § represents untreated control condition.
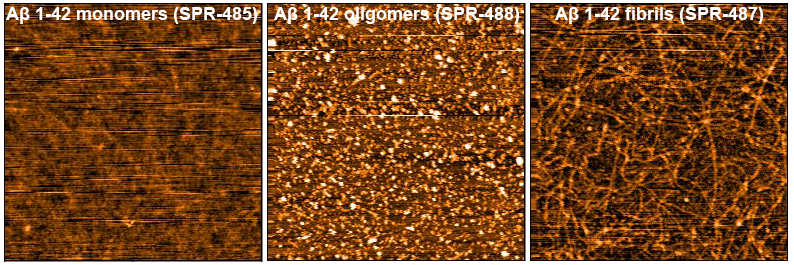
AFM of amyloid beta 1-42 monomers (SPR-485, left), oligomers (SPR-488, middle) and fibrils (SPR-487, right). Atomic force microscopy analysis of 1.0 mg/mL samples diluted to 0.1 mg/mL in dH2O, mounted on freshly cleaved mica, washed, dried and analyzed with tapping mode. Representative images are 2.5 x 2.5 µm x-y with a z-range of 10 nm.
 Powered by Bioz
StressMarq Biosciences :
Based on validation through cited publications.